B.6 Brewer Gold Mine Case Study
Chesterfield County, South Carolina
The mining team would like to acknowledge Jim Gusek, Sovereign Consulting, who submitted this Biochemical Reactors Case Study.
B.6.1 Site Information
Contact
James J. Gusek
Sovereign Consulting, Inc.
12687 West Cedar Drive, Suite 305
Lakewood, Colorado 80228
720-524-4908
Name, Location, and Site Description
The Brewer Gold Mine site is located on the western border of Chesterfield County, South Carolina. The site is located in a rural area approximately one mile west of Jefferson, South Carolina. The property is bordered by Road 265 to the south, unoccupied land to the north and west, and Little Fork Creek to the east. The site is located near a topographic high, sloping to the east toward Little Fork Creek and to the west toward Lynches River. Little Fork Creek enters Lynches River approximately two miles downstream of the site.
Mining activities were conducted on approximately 230 acres of the site. Mining-influenced water (MIW) comes from two sources at the site: a flooded open pit and a spent cyanide heap leach pad. This case study focuses on the biochemical reactor (BCR)An engineered treatment system that uses an organic substrate to drive microbial and chemical reactions to reduce concentration of metals, acidity, and sulfate in mining-influenced water. treating effluent from the spent cyanide heap leach pad (Pad 5), which was operated for an approximately 18 month test period in 1993 and 1994.
B.6.2 Mining-Influenced Water Chemistry
Influent water chemistry was monitored approximately weekly between September 1993 and December 1994. Field data (pH, EhThe redox potential is the tendency of a compound to gain an electron. This is most often measured as the voltage required to prevent electrons to transfer between the measured sample and a standard reference electrode. For Eh, that standard reference, defined as zero volts, is H2 → 2 H+ + 2 e- at a specified standard condition. and conductivity) and samples for metals analysis (copper and iron) were collected routinely during this period. Manganese and aluminum were added to the routine sampling suite in October 1993. Sulfate and zinc were measured periodically throughout the test period. Pad 5 influent concentrations fluctuated in response to rainfall events on the heap and the presumed rise of pyrite oxidation activity as buffering leach solutions were rinsed out. Iron concentration varied from 8 mg/L after a leach solution flush to about 3,950 mg/L at decommissioning. Key metals concentrations and field data gathered during the Pad 5 Cell operation are summarized in Table B.6-1.
|
Parameter |
Mean Concentration (Range) |
|---|---|
|
pH |
3.11 (2.06-5.92) |
|
Eh |
477 (223-611) |
|
Conductivity |
6985 (3590-8290) |
|
Sulfate (mg/L) |
3554 (2857-5200) |
|
Copper (mg/L) |
16.73 (2.23-102.4) |
|
Zinc (mg/L) |
0.12 (0.03-0.22) |
|
Iron (mg/L) |
318 (8-3160) |
|
Manganese (mg/L) |
0.68 (0.18-2.8) |
|
Aluminum (mg/L) |
(3.6-1.82) |
B.6.3 System Design
The system designed to treat effluent from Pad 5 consisted of a single anaerobic pilot cellAn individual unit in a treatment system.. A 2.4 ft. deep 4,000 ft2 anaerobic cell was commissioned in early September 1993. The cell was filled with a mixture of composted turkey manure, sawdust, phosphate rock reject (limestone) and cow manure inoculum. Cell dimensions were determined by balancing the estimated volumetric sulfate reducing capacity (about 0.3 moles of sulfate reducedIn chemistry, having gained electrons. Often gaining electrons is accompanied with gaining protons (hydrogen). As an example, when O₂ reacts with H₂, the oxygen is reduced, forming H₂O. per day per cubic meter of substrateEither (a) a chemical which reacts or (b) a solid surface or (c) an electron donor.) with the molar loadingMass of something per time entering a volume (volumetric loading rate) or flowing into an area (areal loading rate). of dissolved metals. The surface area was based on positive experience at other sites (800 ft2 per gpm) with similar water chemistry. Although the cell was designed for a flow of 5 gpm, it actually treated 0.75 gpm for approximately 18 months.
B.6.4 BCR Performance
The BCR was operated by mine personnel, who were instructed to minimize ponding on the cell surface to preclude iron hydroxide formation. The effluent water chemistry varied considerably during the experiment. In one respect, this variation demonstrates the resilience of the treatment system. The Pad 5 cell was originally designed for a flow of 5 gpm. However, by the time the system was commissioned, influent water chemistry had deteriorated to the point that the flow was reduced to prevent overwhelming the cell's biochemistry.
Right after start-up, volunteer vegetation invaded the cell surface, marking the vegetation flourishes period of the cell history (Figure B.6-1). The cell vegetation was intentionally suppressed in two subsequent events and the cell refitted with a fresh source of native hay before the system was decommissioned in February 1995 to accommodate on-going reclamation/closure activities.
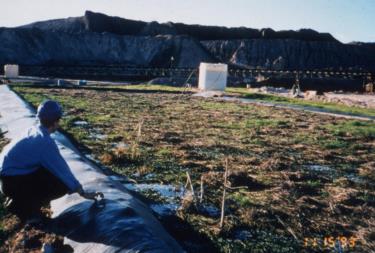
Figure B.6-1. Brewer Pad 5 biochemical reactor with vegetation
As shown in Figure B.6-2, after the start-up period until June 1994 (the vegetation flourishes period), the Pad 5 Cell had erratic metal removal performance. The redox/Eh during this time was also erratic, in concert with the metals removal with the exception of iron, which was nearly 99% removed. Copper removal was particularly variable; at times, copper in the effluent exceeded influent values. That is, copper was being remobilized. Aluminum removal paralleled copper values but never exceeded influent concentrations. Remarkably, effluent pH continued to be around 6.5 during this time despite large variations in influent pH due to leach solution being flushed from the heap after storm events or earthmoving activities.
The high redox/Eh values and other observations (e.g., effluent temperatures higher than 10°C) prompted the intentional elimination of the Pad 5 surface vegetation in June 1994, beginning the post-vegetation I period. Immediately thereafter and until the vegetation was again intentionally eliminated on October 27, 1994 (beginning of the post-vegetation II period), the percent aluminum, copper and iron removed became steadier and more consistently was in the range between 95% and 100%.
Influent metal concentrations began to increase at the beginning of the post-vegetation I period and increased steadily until decommissioning. Iron, in particular, increased to about 3,950 mg/; over an order of magnitude higher than the design concentration or the initial influent concentration. Remarkably, metals removal in the cell kept pace, especially during the post-vegetation II period as shown on Figure 5-1 for aluminum, iron and copper. Flow was maintained at about 0.75 gpm because it was difficult to adjust the flow any lower. Additionally, pH in the effluent decreased from 6.5 to 6.0 during the post-vegetation I period, which prompted the second intentional defoliation event. Towards the last month of the post vegetation I period, the percent removal of aluminum began to drop below 50%, corresponding to a drop in iron removal.
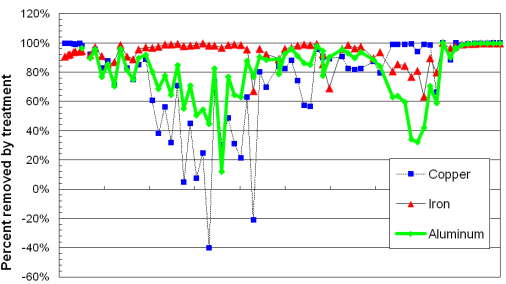
Figure B.6-2. Brewer Pad 5, combined total metals removal.
The vegetation was again eliminated on October 27, 1994. From this time to the decommissioning of the Pad 5 Cell, copper, iron and aluminum removal were consistently very near 100%. The effluent pH was observed to maintain a value of around 6.5. Sulfate influent and effluent differences increased even more markedly than the post vegetation I period.
B.6.5 BCR Monitoring
Influent and effluent samples were collected every few days during September 1993. Influent and effluent samples were collected approximately weekly from October 1993 through December 1994. All samples were analyzed for pH, Eh, conductivity, SO₄, copper, zinc, iron, manganese, aluminum and conductivity. Results are shown in Figure 5-1.
B.6.6 Regulatory Challenges
The primary regulatory challenge faced by this project was the variation in effluent water quality, discussed in detail in Sections 5 and 9 of this case study.
B.6.7 Stakeholder Challenges
The stakeholder challenges at this site are primarily those discussed in sections 5 and 9.
B.6.8 Other Challenges and Lessons Learned
After start-up, this cell apparently removed metals using oxidation reactions promoted by the plants on the cell surface; the limestone in the substrate probably assisted by buffering the iron hydrolysis reactions. This is supported by the excellent iron removal efficiency and the poor to negative removal efficiency for copper.
Once the vegetation was removed the first time, it is believed that anaerobic SRBsulfate-reducing bacteria-fostered reactions returned as the dominant removal mechanism. This is supported by the low redox/Eh, the marked improvement in metals removal, and the observed increases in sulfate reductionThe stripping of oxygen atoms from sulfate (SO₄²⁻), most often yielding sulfide (S²⁻) as an ultimate product..
After the second defoliation, sulfate reduction exceeded design expectations which allowed the cell to continue to function despite the order of magnitude increase in metal loading, most notably iron. The sulfate reduction peaked at a rate of over 2.0 moles/day/cubic meter; it is suspected that this phenomenon would not have continued had the cell been operated for a few more months. The higher than expected rate was likely related to the readily digestible source of carbon provided by the recently killed vegetation. The root and stem tissues of the dead plants appeared to provide a superior nutrient carbon source compared to the hard wood celluloseAn unbranched polymer of glucose found as the primary structural unit for green plants. (sawdust) already present in the substrate. The hay that had been added to the cell during retrofit probably functioned in the same manner. This is consistent with reports of others (Gusek 2000) using ethanol as an organic source.
A carbon mass balanceAn accounting for the mass entering, leaving, accumulating, and reacting in a system, often in the form of an equation such as “In – Out + Generation – Consumption = Accumulation”. analysis was conducted with the available data. During the period when vegetation flourished, the carbon supply to sulfate reducing bacteria was low because of the predominance of aerobic conditions in the substrate. After the successive defoliations, and as sulfate reduction became the predominant biogeochemical reaction in the cell, carbon utilization for sulfate reduction tracked each other remarkably well. That is, all carbon needed to allows sulfate reducers to produce sulfide for metals removal appeared to come from the hard wood substrate and the recently killed plants.
B.6.9 References
Environmental Protection Agency. 2012. NPL Superfund Site Narrative. Brewer Gold Mine, Chesterfield, Jefferson County South Carolina. Updated 3/1/12. http://www.epa.gov/superfund/sites/npl/nar1725.htm.
Gusek, J.J., 2000. Reality Check: Passive Treatment of Mine Drainage and Emerging Technology or Proven Methodology? Presented at SME Annual Meeting, Salt Lake City, Utah, February 28.
Publication Date: November 2013